
Diesel Engine NOx Analyzers: Response Time and NO2 Conversion Explained


A diesel engine changes load in seconds. The emissions signal arriving at the analyzer may tell that story several seconds later—and with its sharpest features softened. Selecting a NOX analyzer for diesel engines therefore requires more than comparing detection limits. Response time and NO2 conversion efficiency can determine whether a system captures transient emissions faithfully or produces a reassuring but misleading trace.
For technical evaluators, the difficult part is separating instrument specifications from complete sampling-system performance. Sample transport, gas conditioning, converter behavior, and signal processing all influence the result. The useful procurement question is not simply “How fast is the analyzer?” It is “How accurately will this configured system measure the emissions event we need to evaluate?”
What the NOx reading actually represents
In diesel emissions measurement, NOx generally means the combined amount of nitric oxide (NO) and nitrogen dioxide (NO2), expressed according to the applicable reporting convention. Their relative proportions are not fixed. Engine operation, exhaust temperature, oxidation catalysts, particulate-filter systems, and selective catalytic reduction (SCR) can change both total NOx and the NO2 fraction.
This matters because different instruments reach a NOx result through different measurement paths:
- Chemiluminescence detectors (CLD): measure NO through its reaction with ozone. To measure total NOx, an upstream converter transforms NO2 into NO.
- Non-dispersive ultraviolet systems: may measure NO and NO2 through separate optical channels, depending on the instrument design.
- Fourier-transform infrared (FTIR) analyzers: can determine NO and NO2 separately using spectral analysis, subject to validated interference correction and sampling conditions.
A direct NO2 measurement avoids dependence on a NO2-to-NO converter, but it does not eliminate sample losses, spectral interference, or response-time limitations. Conversely, a converter-based analyzer can perform well when its efficiency, selectivity, and dynamic behavior are verified. Evaluate the complete measurement method rather than treating one technology as automatically superior.
Response time: the specification that needs a measurement boundary
A supplier’s “response time” can refer to several different quantities. Without a stated injection point and response definition, two apparently comparable numbers may describe entirely different tests.
Some documentation uses “T90” differently. Ask for the response curve and calculation method, not just the label. Also confirm whether the test included the probe, heated line, filters, conditioning equipment, converter, and production data filters.
An analyzer-inlet test characterizes the instrument; a probe-inlet test characterizes much more of the installed system. Both are useful, but they answer different questions.
Why a fast detector can still produce a slow measurement
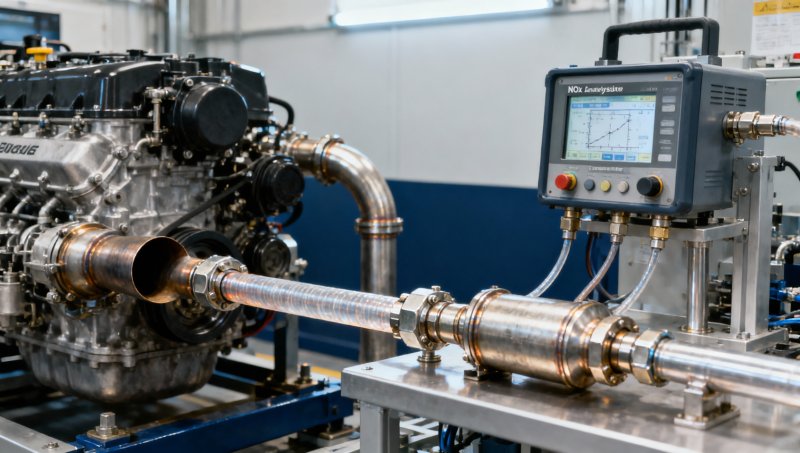
Sample-line volume and actual volumetric flow establish a basic transport timescale. As an illustrative calculation, a 10 m line with a 4 mm internal diameter contains approximately 0.126 L. At an actual flow of 1 L/min inside that line, volume divided by flow gives roughly 7.5 seconds. This excludes filters, manifolds, and other internal volumes; it is not a certified response-time prediction.
The distinction between actual and standardized flow is important. Temperature and pressure change the gas volume passing through a heated line. Mixing volumes, diffusion, adsorption, and instrument filtering also broaden the response. Reducing line length or increasing flow may help, but only within the pressure, pump-capacity, and sampling requirements of the system.
Logging at 10 Hz does not make a slow sampling system fast. It may simply record the same delayed, smoothed signal more frequently.
Delay correction cannot restore a flattened peak
A time shift can align a delayed concentration trace with engine events. It cannot recreate detail lost through mixing or low-pass filtering. This distinction becomes critical when calculating mass emissions, which combine pollutant concentration with exhaust flow using the applicable calculation method.
If concentration and flow are misaligned during acceleration, the resulting mass emission can be biased even when each sensor is individually accurate. There is no universal direction for that bias: it depends on how concentration and flow change together.
For transient testing, verify system response under the intended configuration and apply the governing time-alignment procedure. Do not assume that aligning a visible concentration peak with a torque peak establishes correct synchronization.
NO2 conversion efficiency: a composition-dependent source of error
In a converter-based CLD system, incomplete NO2 conversion causes under-reporting of total NOx, assuming other errors are absent. A simplified relationship is:
Measured NOx = NO + η × NO2
Here, η is NO2 conversion efficiency expressed as a fraction. If the true NO2 fraction of total NOx is f, the approximate fractional under-reading is (1 − η) × f.
Consider an illustrative sample containing 60 ppm NO and 40 ppm NO2. True total NOx is 100 ppm. With 95% conversion efficiency, the analyzer would report approximately 98 ppm under this simplified model. If the NO2 fraction rises, the conversion-related error increases even though converter efficiency remains unchanged.
This is why an efficiency figure cannot be assessed independently of the application. A configuration acceptable for predominantly NO exhaust may be less suitable downstream of an oxidation catalyst, where the NO2 fraction can be higher.
A converter must be efficient—and selective
Converter performance depends on technology, temperature, residence time, condition, and gas composition. Depending on the design, aging, deposits, or unsuitable operating conditions may reduce conversion. Performance at one flow rate or concentration does not establish performance throughout the operating envelope.
Conversion selectivity matters too. Some converter designs may transform other nitrogen-containing compounds into species detected as NO, creating positive interference. In SCR applications, potential ammonia-related effects deserve explicit investigation. Ask suppliers for interference evidence for the actual converter and detector combination, rather than relying on a general technology description.
Water vapor and carbon dioxide can also influence CLD response through quenching. Applicable verification procedures address these effects; passing a converter-efficiency test alone does not demonstrate freedom from matrix-related measurement error.
NO and NO2 may not arrive with the same dynamics
A rapid NO step does not necessarily prove an equally rapid NO2 response. NO2 can interact differently with wetted surfaces and conditioning components, and the converter adds another part of the measurement path.
Systems that alternate between NO and NOx modes introduce another concern. Calculating NO2 by subtracting NO from NOx requires attention to channel timing, switching intervals, and response matching. During a fast transient, subtraction of mismatched signals can generate artificial peaks or even negative calculated values. A simultaneous dual-channel design reduces switching concerns but still requires channel-response verification.
Sample conditioning can change the answer before detection
The heated line is part of the analytical method, not merely an accessory. Uncontrolled cooling or condensation can alter the sample composition, particularly for NO2. Cold spots at fittings, filters, or transitions deserve as much attention as the nominal line-temperature setting.
If a system removes moisture, establish whether that process preserves the target species and whether concentrations are reported on a wet or dry basis. Apply required humidity corrections consistently. Comparing a wet-basis result with a dry-basis result without correction can look like instrument disagreement when it is actually a reporting mismatch.
Maintenance affects dynamic performance as well. Filter loading can change pressure and flow; leaks can dilute the sample; contaminated surfaces may increase retention. Acceptance criteria should cover the maintained operating configuration, not only a clean instrument connected to a short calibration tube.
Which standards should guide the evaluation?
The relevant framework depends on the engine category, jurisdiction, test purpose, and installation. Important starting points include:
- U.S. EPA 40 CFR Part 1065: engine-testing procedures, including analyzer verification, system response, and calculations. Use the provisions applicable to the intended test and equipment.
- UNECE Regulation No. 49: relevant to heavy-duty vehicle engine emissions, with requirements determined by the applicable series of amendments and test procedure.
- ISO 8178 series: relevant to reciprocating internal-combustion-engine exhaust measurement, particularly many non-road applications. Identify the applicable part and edition.
These are not interchangeable purchasing labels. Laboratory engine testing, portable emissions measurement, and stationary-source monitoring may follow different requirements. An automotive sensor or industrial NOx monitor is not automatically suitable for regulatory engine testing.
Request a clause-level compliance matrix linking each applicable requirement to the offered configuration, verification procedure, and evidence. Statements such as “EPA compliant” need a defined scope. ISO/IEC 17025 accreditation can support confidence in specified laboratory activities, but it does not by itself establish analyzer compliance with an emissions procedure.
A practical acceptance plan for a NOX analyzer for diesel engines
Before comparing quotations, define the measurement location, expected concentration range, likely NO2 fraction, transient duty cycle, sample-line length, and relevant test procedure. For low post-SCR concentrations, noise, zero drift, and interference may matter as much as maximum response speed.
Then build acceptance around evidence that suppliers can reproduce:
- Document the full gas path. Record line dimensions, temperatures, flows, pressures, conditioning stages, converter settings, and software filtering.
- Measure rising and falling responses. Use the applicable verification method at the relevant inlet boundary. Preserve raw traces and describe step-generation dynamics.
- Verify NO2 conversion independently. Follow the governing method, which may use an NO2-generating arrangement such as gas-phase titration. Do not infer conversion from an NO calibration alone.
- Check representative matrix effects. Address water, carbon dioxide, and application-relevant interferents, especially where SCR introduces ammonia.
- Confirm synchronization and reporting. Verify timestamps, concentration–flow alignment, wet/dry basis, and the required NOx mass convention.
- Define ongoing verification. Establish checks and corrective actions consistent with the applicable procedure, including after sampling-path or converter changes.
At Global Instrument Hub, the useful distinction in technical sourcing is between a quoted specification and demonstrated fitness for the intended measurement. A fast detector, high converter efficiency, and a recognized standards reference are valuable—but only when they belong to the same validated configuration.
The strongest purchasing decision is therefore not necessarily the instrument with the smallest response-time number. It is the system whose delay, smoothing, conversion behavior, interferences, and uncertainty are documented well enough to support the test. When those boundaries are clear, transient NOx data becomes something evaluators can defend, not merely something they can display.
Recommended for You
 How does multi component monitoring detect gases in stack emissions?Discover how multi component monitoring detects stack gases, manages interference and supports reliable emissions reporting. Explore key CEMS selection factors.
 How bright should an industrial monitor be for outdoor use?Choosing an outdoor industrial monitor? Learn why 1,000 nits is a starting point and how glare, contrast, and heat affect sunlight readability.
 How does water vapor affect infrared gas analyzers?Infrared gas analyzers can be affected by humidity, condensation and spectral interference. Learn how to protect sample integrity and achieve reliable results.
 How to reduce customer support response timesReduce Customer Support response times with actionable tips for reporting equipment faults, choosing the right channel, and getting expert help faster.
 How to choose a low range analyzer for trace-level measurementsChoose the right low range analyzer for trace-level measurements. Compare detection limits, sampling, calibration and support to make a confident decision.
 How to choose combustible gas detectors for a specific gasChoose combustible gas detectors with confidence. Compare sensor technologies, gas response, calibration, placement, and certification for your application.
 How to choose an air quality analyzer for the pollutants you need to measureChoose an air quality analyzer with confidence. Compare pollutant measurement methods, sampling, accuracy and calibration to find the right fit for your needs.
 How to choose industrial metrology tools for tight tolerancesChoose industrial metrology tools for tight tolerances with confidence. Compare uncertainty, calibration, tool types, and costs to reduce inspection risk.
 How moisture affects fixed analyzer accuracy in stack gas monitoringImprove fixed analyzer accuracy in stack gas monitoring. Discover how moisture causes dilution, interference, and sample loss—and learn practical ways to protect emissions data.
 How does production line speed affect in-line measurement accuracy?Discover how production line speed affects in-line measurement accuracy. Explore sensor response, sampling, and timing to boost throughput without compromising quality.
 How condensation affects HCl concentration analyzer accuracyHCl concentration analyzer accuracy can suffer when condensation traps HCl. Learn how to spot sampling losses, prevent low readings, and improve measurement reliability.
 How does cross-interference affect multi-component gas analyzers?How does cross-interference affect multi component gas analyzers? Explore measurement errors, compensation limits, and validation tips to choose the right system for your process.
 How does temperature affect high-accuracy sensor performance?Explore how temperature affects high accuracy sensor performance. Learn to reduce thermal drift, evaluate compensation, and select the right sensor for reliable measurements.
 Can a C4H8O concentration analyzer distinguish between isomers?Can a C4H8O concentration analyzer distinguish isomers? Compare GC, FTIR and MS methods, uncover selectivity limits, and learn what to validate before choosing your instrument.
 How to identify a reliable supplier using on-time delivery recordsIdentify a Reliable Supplier by verifying on-time delivery records, original commitments, and complete shipments. Learn practical checks to reduce purchasing risk and protect your project schedule.
 How sensitive should a portable hydrogen analyzer be for lab use?Choose a portable hydrogen analyzer for laboratory use with the right quantification limit, accuracy, and range. Learn how to verify performance and avoid costly buying mistakes.
 How to set industrial calibration intervals based on equipment riskSet industrial calibration intervals based on equipment risk, drift, and as-found data. Learn when to shorten or extend schedules to improve reliability and avoid unnecessary costs.
 How to choose electrochemical analyzers for low-current measurementsCompare electrochemical analyzers for precise low-current measurements. Learn how noise, leakage, bandwidth, and real-cell testing help you choose the right instrument.
 What tolerance does a custom gas mixture need for calibration?Choose the right custom gas tolerance for calibration. Learn how blending tolerance, certified uncertainty, and stability affect accuracy—and avoid paying for precision you don’t need.
 How condensation affects stack detector readings in wet flue gasStack detector readings can drift when wet flue gas condenses. Learn how to identify moisture interference, prevent sample losses, and improve emissions monitoring reliability.
 How to prevent condensation in a CO2 analyzer sampling systemPrevent condensation in your CO2 analyzer sampling system. Learn how to control dew point, eliminate cold spots, and manage moisture for reliable readings and fewer costly disruptions.
 How to verify accuracy claims for industrial quality analyzersVerify accuracy claims for industrial quality analyzers with calibration checks, independent testing, and clear acceptance criteria. Learn how to reduce risk and buy with confidence.
 How to calculate cooling loads for an industrial analyzer shelterSize industrial analyzer shelter cooling with confidence. Learn to calculate equipment heat, solar gains, and ventilation loads, then select HVAC capacity for reliable analyzer performance.
 Hydrogen Analyzers for Energy Storage: Purity Monitoring vs. Leak DetectionChoosing a hydrogen analyzer for energy storage systems? Compare purity monitoring and leak detection to select the right sensors, improve safety, and protect fuel cell performance.
 NH3 Monitoring in Fertilizer Plants: Where Should Leak Analyzers Be Installed?NH3 analyzer for fertilizer production: discover where to place leak detectors around storage, compressors, and loading areas to reduce blind spots and improve early warning.
 Diesel Engine NOx Analyzers: Response Time and NO2 Conversion ExplainedChoosing a NOX analyzer for diesel engines? Learn how response time, NO2 conversion, and sampling design affect accuracy—and make a smarter, evidence-based purchase.
 SO2 Analyzers for Smelter Emissions: Sampling Hot, Dust-Laden Flue GasSelect an SO2 analyzer for smelting industry applications. Discover how to handle hot, dust-laden flue gas, prevent sample losses, and achieve reliable emissions monitoring.
 Unstable CH4 Readings in Biogas Monitoring? Check Moisture and Sample FlowCH4 analyzer for biogas monitoring giving unstable readings? Discover how moisture, sample flow, and pressure checks help pinpoint faults and restore reliable methane measurements.
 Buying a CO2 Analyzer for Brewery Gas Recovery: Costs Beyond the Purchase PriceBuying a CO2 analyzer for brewery applications? Compare sampling, installation, calibration, and downtime costs to uncover hidden expenses and make a smarter gas recovery investment.
 Where to Place CO Analyzers for Effective Parking Garage VentilationOptimize your CO analyzer for parking garage ventilation with practical placement tips. Learn how sensor height, airflow, and zone coverage support timely detection and effective fan control.
 NDIR vs. FTIR Gas Analyzers: Which Fits Your Environmental Research?Find the right infrared gas analyzer for environmental research. Compare NDIR vs. FTIR on sensitivity, gas coverage, sampling needs, and cost to choose confidently for your study.
 Oxygen Analyzers for Diving: Calibration Checks Before Nitrox BlendingUsing an oxygen analyzer for diving applications? Discover essential calibration, sensor, and sampling checks before nitrox blending to support reliable readings.



Search Categories
Search Categories
- Smart Meters & Power Quality
- Transformer Gas Analyzers
- BESS Thermal Runaway Detectors
- Energy, Power & Smart Grid Monitoring
- Optical Profilers & CMM
- Ultrasonic & X-Ray NDT
- Calibration Standards
- Precision Metrology & NDT
- Water Quality Analyzers
- CEMS & VOCs Monitors
- Price Trends
- Import & Export Updates
- Market Trends
- Industry News
- Industry Insights
Latest Article
- How does multi component monitoring detect gases in stack emissions?Discover how multi component monitoring detects stack gases, manages interference and supports reliable emissions reporting. Explore key CEMS selection factors.Posted by:
- How bright should an industrial monitor be for outdoor use?Choosing an outdoor industrial monitor? Learn why 1,000 nits is a starting point and how glare, contrast, and heat affect sunlight readability.Posted by:
- How does water vapor affect infrared gas analyzers?Infrared gas analyzers can be affected by humidity, condensation and spectral interference. Learn how to protect sample integrity and achieve reliable results.Posted by:
Please give us a message
