
How to verify accuracy claims for industrial quality analyzers


An accuracy claim is useful only when it describes performance under conditions close to your process. When comparing industrial quality analyzers, ask suppliers to connect every claimed tolerance to a defined measurement, operating range, sample type, reference method, and test procedure. A small error measured on a clean standard may say little about performance on a variable production stream.
A defensible purchase requires three things: a clearly defined specification, credible reference measurements, and an independent application test with agreed acceptance criteria. Calibration records support that assessment, but they do not establish that an analyzer will make reliable quality decisions in your installation.
Translate the accuracy claim into a testable specification
Start by defining exactly what the analyzer must measure. Moisture reported on a wet basis differs from moisture on a dry basis. Dissolved metal concentration differs from total metal concentration. Results expressed at actual process conditions may differ from results normalized to a reference temperature or pressure. Instruments can disagree because they report different quantities, even when both operate correctly.
Next, examine how the supplier expresses the claimed error. A percentage of reading changes with the measured value; a percentage of full scale refers to the selected range. These can produce substantially different allowable errors near the bottom of the range. Specifications combining a relative term with a fixed concentration allowance require both terms to be considered.
Ask whether the figure represents a maximum permissible error, typical performance, average bias, or a statistical prediction metric. Those statements support different conclusions. “Typical” performance does not establish a guaranteed limit for the unit being purchased.
An analyzer may give tightly grouped readings while remaining consistently biased. Conversely, a small average bias can hide large positive and negative errors. Ask for both systematic error and result variability, together with their test conditions.
Check what the calibration evidence actually covers
Request records for the proposed instrument configuration, including the measurement range, sensor or optical arrangement, sample conditioning equipment, software version, and calibration model where relevant. A certificate for a component or another model does not demonstrate the performance of the complete supplied system.
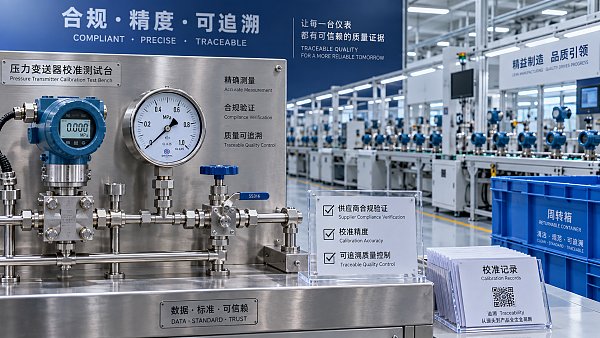
Useful calibration records identify the instrument, reference standards, procedure, environmental conditions, results, and associated measurement uncertainty. Where adjustment occurred, request results before and after adjustment. The earlier results reveal how the instrument behaved when received; the later results show its performance following intervention.
Calibration establishes a relationship between indications and reference values under stated conditions. Verification determines whether specified requirements are met. An instrument can have a current calibration certificate and still fail your application's acceptance limits.
Metrological traceability requires a documented, unbroken chain of calibrations to an appropriate reference, with each link contributing uncertainty. A supplier's statement that equipment is “traceable” should therefore be supported by identifiable records.
ISO/IEC 17025 accreditation can strengthen confidence in laboratory competence, but examine the scope. It should cover the relevant calibration or test activity, range, and capability. Accreditation held by a laboratory does not automatically cover every service it offers, and it does not certify an analyzer's accuracy across all applications.
Choose references that represent the sample
Certified reference materials provide assigned property values with stated uncertainties and traceability information. Their value depends on suitability: concentration range, matrix, physical form, stability, and preparation requirements must match the intended test closely enough to support the comparison.
A clean aqueous standard can check an analyzer's response while leaving production interferences untested. Suspended solids, salts, color, bubbles, viscosity, or particle size may affect the result. For gas analysis, balance gas composition and moisture can matter. Spectroscopic measurements of solids may depend on surface condition and sample presentation.
Use suitable reference materials to check response, then include representative production samples to challenge application performance. Where an appropriate certified material is unavailable, comparison with a competent laboratory using a suitable reference method can provide evidence. Document the method's uncertainty and sample handling requirements.
The reference method must measure the same property. For example, loss on drying may include volatile substances other than water, so it may disagree with a water-specific method for a legitimate chemical reason. Resolve that difference before judging either instrument.
Reference uncertainty also limits what the test can establish. If it is comparable to the analyzer's allowable error, an apparently close result may provide weak evidence of compliance. Select the reference capability and conformity decision rule together.
Design an application test the supplier cannot pass through calibration alone
Agree the protocol before testing begins. Define sample selection, operating conditions, permitted adjustments, data exclusions, statistical treatment, and pass criteria. This prevents a favorable demonstration from becoming the acceptance standard after results are available.
For analyzers using empirical calibration models, separate calibration samples from validation samples. Testing only materials used to build the model rewards fitting performance and can conceal poor predictions on unfamiliar production batches.
Keep validation reference values hidden from the supplier until analyzer results are recorded. If the supplier adjusts the model after reviewing those values, evaluate the revised model with a fresh independent set. Otherwise, the supposed validation data have become part of calibration development.
A practical test should include:
- The working range: Cover routine concentrations, range boundaries, and values close to quality decision limits.
- Relevant sample variation: Include feedstocks, grades, contaminants, and physical conditions expected in production.
- Repeated measurements: Assess short-term repeatability, then repeat selected checks across days, operators, or sample preparations as appropriate.
- Operating challenges: Test relevant temperature, flow, pressure, humidity, and fouling conditions within the proposed operating envelope.
- Time-dependent behavior: Examine drift, carryover, stabilization after startup, and recovery after concentration changes.
Choose the amount of testing according to variability and decision risk. Repeated readings of one stable sample reveal little about matrix effects. A broad collection measured once may reveal application differences but provide weak evidence about repeatability. Both questions need attention.
Record failed measurements, alarms, manual interventions, and rejected results. An analyzer that reports accurate values only after frequent operator intervention may be unsuitable for unattended control, even if the retained results look excellent.
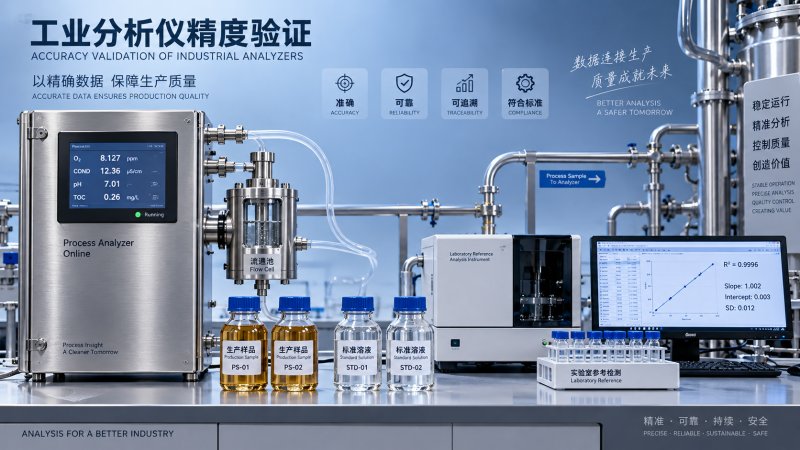
For online analyzers, verify the complete sampling path
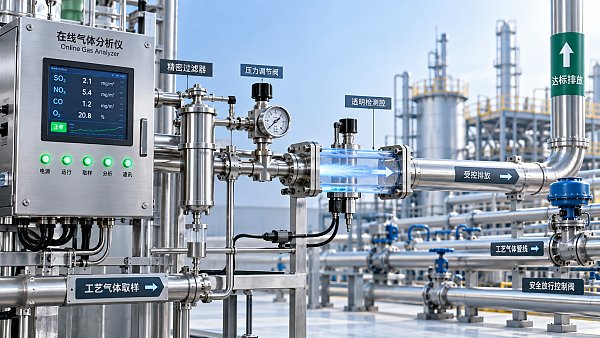
The installed measurement includes more than the analyzer cabinet. Probe location, transport tubing, filters, pressure reduction, dilution, and sample temperature can change the material reaching the sensor.
A filter may remove particles containing the constituent of interest. A volatile component may escape during transport. Deposits can retain material and release it later, producing carryover. These effects can dominate uncertainty even when the sensing element performs well.
Compare results from samples representing the same process condition. A laboratory grab sample collected near a probe does not automatically correspond to an analyzer reading displayed at that moment. Transport delay and internal averaging can shift the analyzer's response. Establish the time alignment before interpreting disagreement.
Test response time separately from steady-state error. A slow analyzer may accurately describe an earlier process state while missing a short excursion that matters for product release or process control. Decide whether the reported result must represent an instantaneous value, a batch average, or a moving average.
Read the validation results beyond a single headline number
Request paired analyzer and reference results, sample identifiers, operating conditions, timestamps, and a record of exclusions. For each pair, calculate the difference between the analyzer result and the reference result. Examine those differences across concentration, sample type, and time.
A correlation coefficient alone is insufficient. Two methods can track concentration changes closely while maintaining an unacceptable offset or proportional error. A wide concentration range can also make correlation look impressive while hiding weak performance near a narrow release threshold.
Plot measurement differences against reference concentration. A rising error pattern can indicate proportional bias; widening scatter may suggest concentration-dependent variability. Separate clusters can expose matrix effects that disappear when all results are combined.
For prediction-based instruments, metrics such as root mean square prediction error help summarize performance on independent samples. They remain averages across a dataset. Inspect individual errors and relevant subgroups, especially when occasional large errors could release off-specification material.
Treat outlier removal as a technical decision requiring a documented cause. A transcription error differs from an unexplained analyzer failure. Removing difficult samples because they reduce apparent accuracy makes the reported performance less representative of production.
Set acceptance limits around the quality decision
Define the allowable measurement error from the process requirement before comparing suppliers. The useful question is whether measurement performance supports reliable decisions at the relevant specification limits. A better datasheet figure has little value if it applies to an irrelevant range or sample type.
Account for uncertainty in the comparison and in routine use. Reference uncertainty, sampling, preparation, repeatability, and drift can all contribute. Avoid adding overlapping terms twice; an uncertainty assessment should identify what each contribution includes.
Where results determine product acceptance, establish a decision rule explaining how uncertainty affects pass or fail judgments. A guard band can move an acceptance boundary inward to reduce false acceptance risk, while potentially increasing false rejection. The appropriate rule depends on the consequences of each outcome.
Write separate requirements where needed for bias, variability, response time, drift, and measurement availability. A single average-error limit may allow operational weaknesses to pass unnoticed. State how borderline results will be handled and what evidence permits a retest.
Make demonstrated performance part of the purchase agreement
Compare suppliers against the same application requirements and evidence standard. A slightly less impressive specification supported by representative independent testing may provide a stronger procurement basis than a tighter claim demonstrated only on ideal standards.
Include the agreed range, sample matrices, reference procedure, acceptance criteria, calibration conditions, and software or model identification in the technical agreement. Specify which checks occur during factory acceptance and which must be repeated after installation, where sampling and environmental effects become visible.
Also establish calibration checks, maintenance responsibilities, and triggers for renewed validation. New feedstocks, revised models, sensor replacement, or significant process changes can alter performance. The purchase decision should leave a clear record of what was demonstrated, under which conditions, and how that performance will be maintained.
Recommended for You
 How to verify accuracy claims for industrial quality analyzersVerify accuracy claims for industrial quality analyzers with calibration checks, independent testing, and clear acceptance criteria. Learn how to reduce risk and buy with confidence.
 How to calculate cooling loads for an industrial analyzer shelterSize industrial analyzer shelter cooling with confidence. Learn to calculate equipment heat, solar gains, and ventilation loads, then select HVAC capacity for reliable analyzer performance.
 How Do You Handle Analyzer Failure During an Environmental Audit?Learn how to handle analyzer failure during environmental compliance audit procedures. Protect evidence, verify data, and restore monitoring with this practical response guide.
 Do VOC Monitors Require Explosion-Proof Certification?Does VOC monitoring require explosion-proof certification? Learn when approval is needed, compare ATEX and IECEx, and choose the right monitor for your site.
 How sample conditioning affects accuracy in petrochemical analyzersImprove accuracy in petrochemical analyzers with smarter sample conditioning. Discover how phase control, filtration, and transport design prevent bias and deliver reliable process data.
 How to troubleshoot sensor drift in industrial gas detectorsIndustrial gas detectors showing sensor drift? Learn how to verify calibration gas, identify root causes, and determine when sensor replacement is needed for reliable monitoring.
 How to judge whether a competitive price reflects real valueCompetitive Price: learn how to compare scope, compliance, performance, and lifecycle costs to identify real value, reduce risk, and make smarter purchasing decisions.
 When custom gas analysis is the right fit for complex process streamsCustom gas analysis for complex process streams: learn when tailored sampling, interference control, and reliable measurement design deliver confident decisions.
 When does a laser gas analyzer meet stack emissions monitoring needs?Laser gas analyzer for stack emissions: learn when it delivers fast, reliable data, how to assess installation risks, and what to verify for CEMS compliance.
 How to select a hazardous gas analyzer for confined spacesHazardous gas analyzer selection for confined spaces: compare sensors, sampling, certifications, alarms, and maintenance to protect workers and choose with confidence.
 When is a single gas analyzer sufficient for workplace safety monitoring?Discover when a single gas analyzer delivers reliable workplace safety monitoring, and learn the key limits, calibration needs, and risks that require broader detection.
 How to choose an ambient gas analyzer for low-level leak detectionAmbient gas analyzer selection for low-level leak detection: compare sensitivity, cross-sensitivity, sampling design, alarms, and calibration for reliable site performance.
 How to tell when an oxygen sensor needs replacementOxygen sensor replacement signs explained: learn how live data, fault codes, wiring checks, and exhaust inspections pinpoint the real issue before you buy.
 How laser gas analyzers improve combustion control in steel furnacesLaser gas analyzer for steel industry applications delivers fast in-situ O₂ and CO data to optimize furnace combustion, cut fuel waste, and improve steel heating stability.
 How to verify whether explosion proof equipment meets site requirementsExplosion proof equipment verification made practical: match zones, gas or dust groups, temperature classes, certificates, and installation conditions for confident compliance.
 How industrial gas analysis helps detect contamination before releaseIndustrial Gas Analysis helps detect moisture, oil, oxygen, and toxic contaminants before release—protecting processes, ensuring compliance, and reducing costly risks.
 When is electrochemistry detection the right choice for water analysis?Electrochemistry detection for water analysis: learn when fast, reliable monitoring of ions, chlorine, pH, and more delivers actionable results.
 How industrial standards reduce quality risks in supplier selectionIndustrial Standard guidance helps quality and safety managers reduce supplier risks, verify compliance, strengthen traceability, and build resilient instrumentation supply chains.
 When does a multi-component system reduce installation complexity?Multi component systems reduce installation complexity when they eliminate field interfaces, streamline commissioning, and provide proven compatibility. Learn how to assess total cost and supplier accountability.
 How to size an industrial control shelter for outdoor equipmentIndustrial control shelter sizing guide: optimize layout, HVAC, access, safety, and expansion space for reliable outdoor equipment operations.
 How flue analysis helps verify combustion efficiencyFlue analysis verifies combustion efficiency by assessing O2, CO, CO2, and stack temperature to identify excess air, incomplete combustion, and heat losses.
 How to select industrial gas detectors for confined spacesIndustrial gas detectors for confined spaces: learn how to match sensors, sampling methods, alarms, and certifications to real atmospheric hazards.
 When does a laser oxygen analyzer outperform zirconia sensors?Laser oxygen analyzer vs. zirconia sensors: compare speed, selectivity, maintenance, gas chemistry, and installation needs to choose the right oxygen measurement solution.
 How to select a percent range analyzer for process measurementsPercent range analyzer selection made practical: compare accuracy, sample systems, calibration, gas matrix, integration, and lifecycle cost for reliable process measurements.
 How explosion proof analysis verifies safe equipment for hazardous areasExplosion proof analysis verifies hazardous-area equipment by matching certifications, temperature ratings, installation details, and inspection controls for safer compliance.
 When does fixed gas detection need point sensors instead of open-path monitoring?Fixed gas detection: discover when point sensors outperform open-path monitoring for predictable leaks, enclosed zones, local alarms, and safer design decisions.
 How to choose industrial metrology systems for tight-tolerance partsIndustrial metrology guide for tight-tolerance parts: compare CMMs, optical scanners, gauges, uncertainty, workflow, and traceable inspection strategies.
 How process metrology reduces measurement variation in productionProcess metrology reduces production measurement variation by improving traceability, uncertainty control, calibration, and reliable quality decisions.
 How to select an industrial monitoring analyzer for harsh environmentsIndustrial monitoring analyzer selection for harsh environments: evaluate sampling, durability, hazardous-area compliance, accuracy, maintenance, and data reliability.
 How calibration intervals affect test and measurement equipment accuracyTest and measurement equipment calibration intervals directly affect accuracy, risk, compliance, and uptime. Learn how to set evidence-based schedules that protect critical decisions.
 When does process gas monitoring need continuous measurement?Process gas monitoring needs continuous measurement when rapid changes threaten safety, quality, compliance, or uptime. Learn how to specify reliable, actionable monitoring systems.
 How to prevent false alarms in power plant instrumentationPower plant instrumentation guide: prevent false alarms with reliable signal checks, smarter alarm settings, mode-based control, and actionable operator responses.





Search Categories
Search Categories
- Smart Meters & Power Quality
- Transformer Gas Analyzers
- BESS Thermal Runaway Detectors
- Energy, Power & Smart Grid Monitoring
- Optical Profilers & CMM
- Ultrasonic & X-Ray NDT
- Calibration Standards
- Precision Metrology & NDT
- Water Quality Analyzers
- CEMS & VOCs Monitors
- Price Trends
- Import & Export Updates
- Market Trends
- Industry News
- Industry Insights
Latest Article
- How to verify accuracy claims for industrial quality analyzersVerify accuracy claims for industrial quality analyzers with calibration checks, independent testing, and clear acceptance criteria. Learn how to reduce risk and buy with confidence.Posted by:
- How to calculate cooling loads for an industrial analyzer shelterSize industrial analyzer shelter cooling with confidence. Learn to calculate equipment heat, solar gains, and ventilation loads, then select HVAC capacity for reliable analyzer performance.Posted by:
- How Do You Handle Analyzer Failure During an Environmental Audit?Learn how to handle analyzer failure during environmental compliance audit procedures. Protect evidence, verify data, and restore monitoring with this practical response guide.Posted by:
Please give us a message
