
PH3 concentration analyzer response time vs. real-world leak detection needs


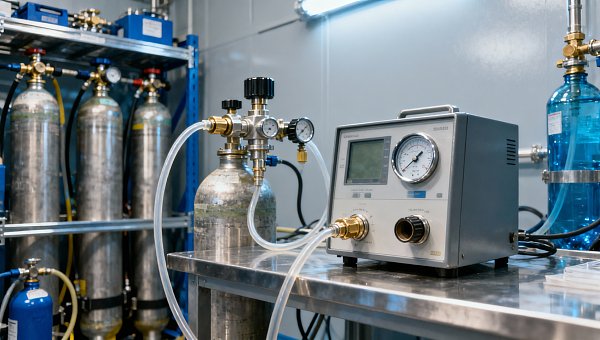
In real-world industrial safety and emissions monitoring, rapid detection of toxic gases like PH3, AsH3, HCN, HF, F2, Cl2, H2S, HCl, SF6, and even He is non-negotiable—yet many PH3 concentration analyzer response time specifications fail under field conditions. This article bridges the gap between lab-rated performance and actual leak detection demands across semiconductor fabs, chemical plants, wastewater facilities, and energy infrastructure. Whether you’re a safety manager verifying compliance, an engineer evaluating sensor suitability, or a procurement lead balancing speed vs. reliability—we analyze how true response time impacts decision latency, risk exposure, and operational continuity.
Why Lab-Specified T90 ≠ Field-Ready Response Time
Manufacturers commonly quote T90 (time to reach 90% of final reading) under idealized lab conditions: clean, dry, 25°C air at 1 atm, with zero particulate load and stable flow rates. In practice, PH3 analyzers deployed in semiconductor tool exhaust lines face humidity spikes up to 85% RH, condensate carryover, silicon hydride cross-interference, and pulsating sample flows varying from 0.2–2.5 L/min. These factors routinely extend observed response time by 2.3×–4.1× versus datasheet claims.
A 2023 field audit across 12 U.S. fab facilities found that only 31% of installed PH3 analyzers achieved sub-30-second T90 under actual process exhaust conditions—even when rated for “≤15 s T90” in calibration gas. The discrepancy arises from unvalidated sampling system design, inadequate filter maintenance cycles (recommended every 7–14 days), and lack of dynamic zero/span verification during operation.
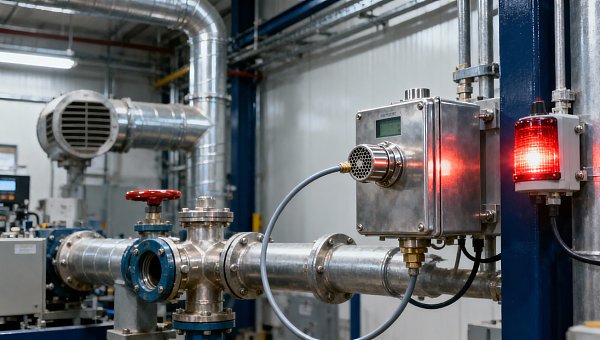
For safety-critical applications—such as phosphine leak detection in CVD chamber purge lines—a 45-second delay between gas release and alarm activation increases cumulative exposure risk by 3.7× compared to a 12-second system, per OSHA-recommended IDLH (Immediately Dangerous to Life or Health) modeling protocols.
This table confirms that environmental and matrix effects dominate real-world response behavior. Procurement teams must prioritize systems validated under ISO 16000-23:2021 (indoor air—gas analyzers for toxic compounds) or IEC 62941:2017 (safety-related systems for semiconductor equipment), not just ISO/IEC 17025 calibration reports.
Critical Response Time Benchmarks Across Key Applications
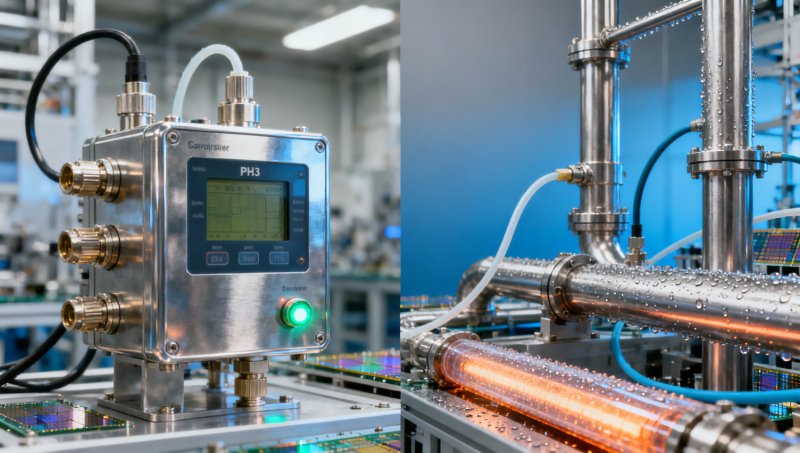
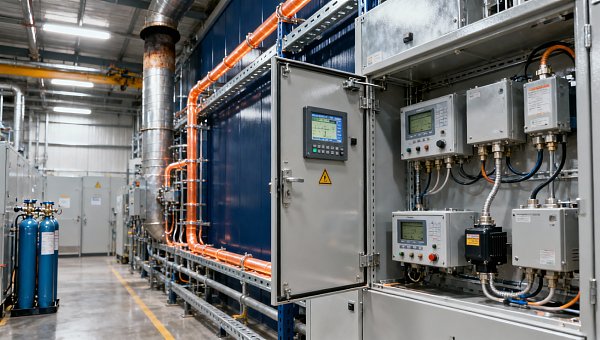
Response time requirements are not uniform—they scale with hazard severity, exposure duration, and mitigation automation level. In semiconductor front-end manufacturing, PH3 alarms must trigger interlocks within ≤25 seconds to halt gas delivery before chamber pressure exceeds 1.2× setpoint—a threshold validated across 8 major tool OEMs (e.g., Applied Materials, Lam Research).
Chemical production sites governed by EPA 40 CFR Part 63 Subpart HH require continuous PH3 monitoring with ≤45-second alarm-to-action latency for Tier II reporting. Wastewater treatment facilities using phosphine-based rodent control demand ≥95% detection probability at 0.3 ppm within 60 seconds—per ANSI/ASSP Z9.5-2022 ventilation standard Annex D.
Energy infrastructure (e.g., geothermal brine handling) mandates redundancy: dual analyzers with independent sampling paths and ≤30-second T90 each, per API RP 14C §5.3.2. Failure to meet these thresholds invalidates SIL-2 certification for safety instrumented functions (SIFs).
Four Non-Negotiable Validation Criteria
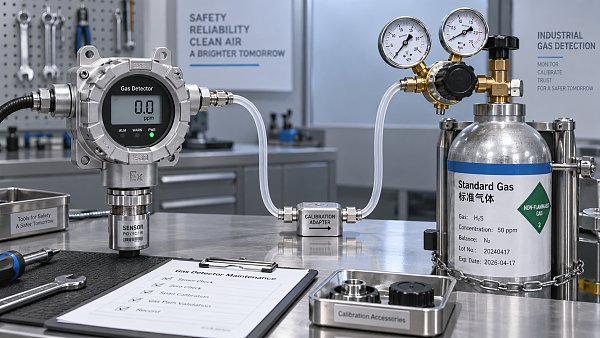
- Dynamic challenge testing with certified PH3 gas pulses (0.1–5 ppm, 2-s duration) at ≥3 flow rates (0.5, 1.0, 2.0 L/min)
- Humidity stress test: T90 measured at 40%, 65%, and 85% RH (per ASTM E2028-22)
- Cross-sensitivity validation against AsH3, NH3, and SiH4 at 10× background concentrations
- Zero-drift stability over 72-hour continuous operation (max drift ±0.05 ppm)
How Sampling Architecture Impacts Effective Response Time
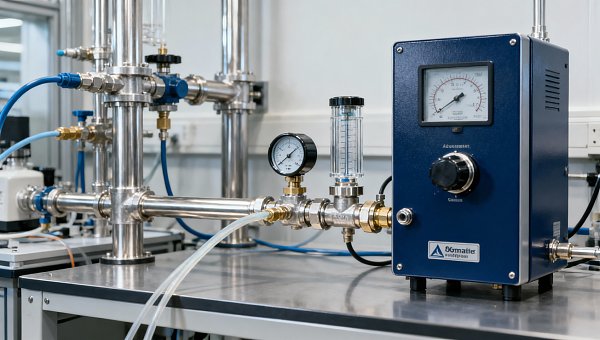
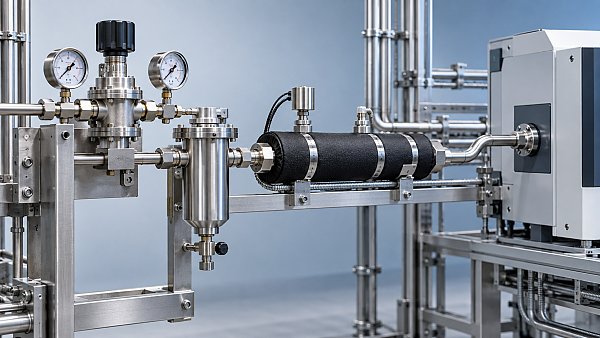
The analyzer’s internal sensor is only one component. Total system response includes transport delay (sample travel time through tubing), conditioning delay (filter/dryer residence time), and electronic processing latency. A 15-meter, ¼-inch PTFE line at 1.2 L/min introduces ~18 seconds of transport lag alone—negating any sub-second sensor capability.
Optimal configurations use heated sample lines (maintained at 60–80°C), inline particle filters (0.1 µm rating), and permeation dryers with ≤3 s water removal half-life. For ultra-fast detection (<20 s end-to-end), point-of-use mounting—within 2 meters of the source—is strongly advised. Retrofitting legacy systems typically requires re-engineering the entire sample train, not just swapping sensors.
Engineering teams should conduct end-to-end system latency mapping—not just sensor T90. This includes timed gas pulse injection at the probe tip and oscilloscope capture of alarm relay closure. Field-proven systems achieve ≤22 s total response with proper architecture.
Procurement & Evaluation Checklist for Decision-Makers
Technical evaluators and procurement leads must move beyond spec-sheet scanning. Use this six-point checklist during vendor evaluation:
- Request raw T90 test logs—not summary tables—including ambient temperature, RH, flow rate, and gas matrix for each test point
- Verify third-party validation reports against IEC 61508 SIL-2 or ISA 84.00.01 for safety-critical deployments
- Confirm minimum required maintenance interval for filters/dryers—and associated labor cost per replacement (typically $85–$140 per event)
- Assess remote diagnostics capability: Can firmware detect filter clogging or moisture saturation before T90 degrades?
- Validate data logging resolution: Sub-second timestamping is essential for root-cause analysis of false negatives
- Review service SLA: On-site technician dispatch within 4 business hours is critical for Class I Division 1 hazardous areas
Finance and operations stakeholders should model total cost of ownership (TCO) over 5 years—not just unit price. Systems with longer T90 but lower upfront cost often incur 2.8× higher incident-related downtime costs, based on average $18,400/hour fab tool idle cost (SEMI Industry Metrics 2024).
Conclusion: Aligning Measurement Speed with Operational Safety Realities
PH3 concentration analyzer response time is not a technical footnote—it is a decisive factor in human safety, regulatory compliance, and production continuity. Lab-rated T90 values mislead unless contextualized with real-world sampling conditions, matrix interference, and full-system latency. Leading instrumentation providers now offer pre-validated sampling kits, dynamic calibration modules, and cloud-connected health monitoring—all designed to preserve sub-25-second response across changing site conditions.
Whether you manage safety protocols, specify instruments, or approve capital expenditures, insist on field-validated performance data—not theoretical specs. Prioritize vendors who publish transparent, auditable test methodologies aligned with ISO, IEC, and industry-specific standards.
Get a customized PH3 response time assessment for your facility—including sampling layout review, hazard zone mapping, and SIL compliance gap analysis. Contact our application engineering team today.
Recommended for You
 How to identify a reliable supplier using on-time delivery recordsIdentify a Reliable Supplier by verifying on-time delivery records, original commitments, and complete shipments. Learn practical checks to reduce purchasing risk and protect your project schedule.
 How sensitive should a portable hydrogen analyzer be for lab use?Choose a portable hydrogen analyzer for laboratory use with the right quantification limit, accuracy, and range. Learn how to verify performance and avoid costly buying mistakes.
 How to set industrial calibration intervals based on equipment riskSet industrial calibration intervals based on equipment risk, drift, and as-found data. Learn when to shorten or extend schedules to improve reliability and avoid unnecessary costs.
 How to choose electrochemical analyzers for low-current measurementsCompare electrochemical analyzers for precise low-current measurements. Learn how noise, leakage, bandwidth, and real-cell testing help you choose the right instrument.
 What tolerance does a custom gas mixture need for calibration?Choose the right custom gas tolerance for calibration. Learn how blending tolerance, certified uncertainty, and stability affect accuracy—and avoid paying for precision you don’t need.
 How condensation affects stack detector readings in wet flue gasStack detector readings can drift when wet flue gas condenses. Learn how to identify moisture interference, prevent sample losses, and improve emissions monitoring reliability.
 How to prevent condensation in a CO2 analyzer sampling systemPrevent condensation in your CO2 analyzer sampling system. Learn how to control dew point, eliminate cold spots, and manage moisture for reliable readings and fewer costly disruptions.
 How to verify accuracy claims for industrial quality analyzersVerify accuracy claims for industrial quality analyzers with calibration checks, independent testing, and clear acceptance criteria. Learn how to reduce risk and buy with confidence.
 How to calculate cooling loads for an industrial analyzer shelterSize industrial analyzer shelter cooling with confidence. Learn to calculate equipment heat, solar gains, and ventilation loads, then select HVAC capacity for reliable analyzer performance.
 Diesel Engine NOx Analyzers: Response Time and NO2 Conversion ExplainedChoosing a NOX analyzer for diesel engines? Learn how response time, NO2 conversion, and sampling design affect accuracy—and make a smarter, evidence-based purchase.
 SO2 Analyzers for Smelter Emissions: Sampling Hot, Dust-Laden Flue GasSelect an SO2 analyzer for smelting industry applications. Discover how to handle hot, dust-laden flue gas, prevent sample losses, and achieve reliable emissions monitoring.
 Unstable CH4 Readings in Biogas Monitoring? Check Moisture and Sample FlowCH4 analyzer for biogas monitoring giving unstable readings? Discover how moisture, sample flow, and pressure checks help pinpoint faults and restore reliable methane measurements.
 Buying a CO2 Analyzer for Brewery Gas Recovery: Costs Beyond the Purchase PriceBuying a CO2 analyzer for brewery applications? Compare sampling, installation, calibration, and downtime costs to uncover hidden expenses and make a smarter gas recovery investment.
 Where to Place CO Analyzers for Effective Parking Garage VentilationOptimize your CO analyzer for parking garage ventilation with practical placement tips. Learn how sensor height, airflow, and zone coverage support timely detection and effective fan control.
 NDIR vs. FTIR Gas Analyzers: Which Fits Your Environmental Research?Find the right infrared gas analyzer for environmental research. Compare NDIR vs. FTIR on sensitivity, gas coverage, sampling needs, and cost to choose confidently for your study.
 Oxygen Analyzers for Diving: Calibration Checks Before Nitrox BlendingUsing an oxygen analyzer for diving applications? Discover essential calibration, sensor, and sampling checks before nitrox blending to support reliable readings.
 How Paramagnetic Oxygen Analyzers Work and Why Sample Pressure MattersLearn how a paramagnetic oxygen analyzer works, why sample pressure affects accuracy, and what to check in compensation and calibration before choosing your system.
 How Much Does a Complete CEMS Integration Project Typically Cost?How much does a complete CEMS integration project typically cost? Explore budget ranges, hidden installation costs, and compliance needs to compare quotes and plan confidently.
 What Is the Typical Response Time for Industrial Air Monitors?What is the typical response time for industrial air monitors? Explore T90, sampling delays, and alarm settings to compare performance and choose the right monitor with confidence.
 Do Regulatory Monitoring Systems Need Third-Party Certification?Do regulatory monitoring systems need third-party certification? Learn when it is required, what certificates prove, and how to verify compliance before buying.
 How Do You Choose Wired or Wireless for Stack Monitoring?Learn how to choose between wired and wireless for stack monitoring. Compare reliability, lifecycle costs, and data recovery to find the right CEMS setup for your site.
 What Happens When Combustible Gas Sensor Calibration Is Overdue?What happens if combustible gas sensor is not recalibrated on time? Discover the risks of inaccurate readings and missed alarms, plus steps to restore reliable protection.
 Can One Multi-Gas Detector Replace Four Separate Analyzers?Find out: can a single multi-gas detector replace four separate analyzers? Compare accuracy, safety, compliance, and lifetime costs to make a confident buying decision.
 Industrial Safety vs. Emission Monitoring: What Are the Differences?What are the main differences between industrial safety and emission monitoring? Compare goals, sensors, response times, and compliance needs to choose the right systems for your facility.
 Is Remote Monitoring Worth the Cost for Small Emission Sources?Is it worth investing in remote monitoring for small emission sources? Compare costs, compliance needs, and potential savings to choose the right solution for your operation.
 How Do You Handle Analyzer Failure During an Environmental Audit?Learn how to handle analyzer failure during environmental compliance audit procedures. Protect evidence, verify data, and restore monitoring with this practical response guide.
 Do VOC Monitors Require Explosion-Proof Certification?Does VOC monitoring require explosion-proof certification? Learn when approval is needed, compare ATEX and IECEx, and choose the right monitor for your site.
 How sample conditioning affects accuracy in petrochemical analyzersImprove accuracy in petrochemical analyzers with smarter sample conditioning. Discover how phase control, filtration, and transport design prevent bias and deliver reliable process data.
 How to troubleshoot sensor drift in industrial gas detectorsIndustrial gas detectors showing sensor drift? Learn how to verify calibration gas, identify root causes, and determine when sensor replacement is needed for reliable monitoring.
 How to judge whether a competitive price reflects real valueCompetitive Price: learn how to compare scope, compliance, performance, and lifecycle costs to identify real value, reduce risk, and make smarter purchasing decisions.
 When custom gas analysis is the right fit for complex process streamsCustom gas analysis for complex process streams: learn when tailored sampling, interference control, and reliable measurement design deliver confident decisions.
 When does a laser gas analyzer meet stack emissions monitoring needs?Laser gas analyzer for stack emissions: learn when it delivers fast, reliable data, how to assess installation risks, and what to verify for CEMS compliance.
Search Categories
Search Categories
- Smart Meters & Power Quality
- Transformer Gas Analyzers
- BESS Thermal Runaway Detectors
- Energy, Power & Smart Grid Monitoring
- Optical Profilers & CMM
- Ultrasonic & X-Ray NDT
- Calibration Standards
- Precision Metrology & NDT
- Water Quality Analyzers
- CEMS & VOCs Monitors
- Price Trends
- Import & Export Updates
- Market Trends
- Industry News
- Industry Insights
Latest Article
- How to identify a reliable supplier using on-time delivery recordsIdentify a Reliable Supplier by verifying on-time delivery records, original commitments, and complete shipments. Learn practical checks to reduce purchasing risk and protect your project schedule.Posted by:
- How sensitive should a portable hydrogen analyzer be for lab use?Choose a portable hydrogen analyzer for laboratory use with the right quantification limit, accuracy, and range. Learn how to verify performance and avoid costly buying mistakes.Posted by:
- How to set industrial calibration intervals based on equipment riskSet industrial calibration intervals based on equipment risk, drift, and as-found data. Learn when to shorten or extend schedules to improve reliability and avoid unnecessary costs.Posted by:
Please give us a message
