Electrochemistry Analyzer vs Other Methods: What Really Affects Accuracy


When comparing an Electrochemistry Analyzer with titration, spectroscopy, or sensor-based methods, accuracy is rarely determined by the instrument alone. For technical evaluators, the real differences often come from sample preparation, calibration discipline, electrode condition, environmental stability, and data interpretation. Understanding these factors is essential for selecting a method that delivers reliable, repeatable results across laboratory, industrial, and quality-control applications.
In the instrumentation industry, method selection is not only a laboratory decision. It affects production release, environmental compliance, utility optimization, incoming material inspection, and long-term process control. An Electrochemistry Analyzer may look highly precise on a specification sheet, yet practical accuracy can shift significantly when samples vary in conductivity, matrix complexity, temperature, or operator consistency.
For technical evaluation teams, the key question is not which method sounds more advanced, but which method remains dependable across 3 critical dimensions: repeatability, traceability, and fit for the application environment. That is especially important in industrial manufacturing, energy and power, environmental monitoring, medical testing, laboratory analysis, and automation systems where decisions often depend on small measurement differences.
Why Accuracy Differences Appear Across Methods
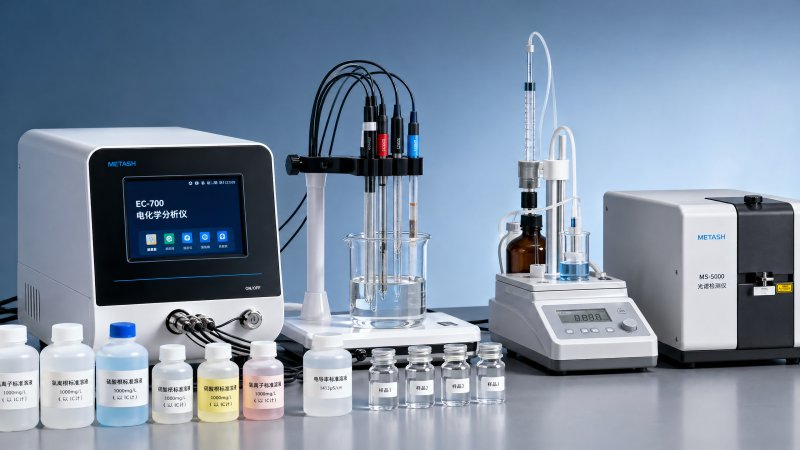
An Electrochemistry Analyzer measures chemical behavior through electrical signals such as potential, current, conductivity, or impedance. In many use cases, it offers fast response, low reagent consumption, and strong suitability for online or bench-top testing. However, it does not automatically outperform titration, spectroscopy, or sensor arrays in every application. Accuracy is always conditional on method fit.
Titration often performs well when the endpoint chemistry is clear and the sample matrix is relatively stable. Spectroscopy is usually preferred for multi-component analysis or trace-level screening when optical interference is manageable. Sensor-based methods can be effective for continuous field monitoring, but long-term drift, fouling, and cross-sensitivity may increase total error over 30 to 90 days if maintenance intervals are not controlled.
For a technical evaluator, the real comparison should start with the measurement task: Is the target concentration in the ppm, ppb, or percentage range? Is the sample aqueous, viscous, particulate, or corrosive? Does the process require results in less than 60 seconds, or is a 10-minute laboratory cycle acceptable? These variables often influence final accuracy more than the instrument category itself.
Common sources of method-related error
Most accuracy loss comes from controllable factors rather than hardware failure. In routine industrial and laboratory practice, four error sources appear repeatedly:
- Sample preparation inconsistency, including filtration, dilution ratio, digestion, or incomplete mixing.
- Calibration mismatch, such as using standards outside the expected operating range or extending calibration intervals beyond 7 to 30 days.
- Environmental instability, especially temperature shifts greater than 2°C, vibration, electromagnetic interference, or uncontrolled humidity.
- Data interpretation errors, including endpoint selection, baseline correction, and misuse of compensation algorithms.
An Electrochemistry Analyzer is often strong in process adaptability, but it is also sensitive to electrode surface condition, ionic strength, and reference stability. By contrast, spectroscopy may be less affected by electrode wear but more vulnerable to turbidity, bubbles, color overlap, or stray light. Titration can be highly reliable, yet manual operation differences may create 1% to 3% variation between operators.
Method comparison at a practical evaluation level
The table below highlights how an Electrochemistry Analyzer compares with other methods when technical evaluators focus on real-world accuracy drivers rather than brochure claims.
The main takeaway is that no method is universally more accurate. An Electrochemistry Analyzer often wins where fast response, selective ion behavior, and process integration matter. Other methods may outperform it when matrix complexity, optical quantification, or formal standard method requirements define the test.
What Really Affects an Electrochemistry Analyzer in Daily Use
In practice, the performance of an Electrochemistry Analyzer depends on discipline around sample handling and system condition. A difference as small as a 1:10 versus 1:20 dilution ratio can move the measured result outside an internal acceptance band. In pH, ORP, ion-selective, or conductivity testing, matrix control matters as much as the analyzer electronics.
Electrodes are often the most underestimated component. Their response slope, membrane integrity, junction condition, and contamination state directly affect stability. For many routine applications, electrode inspection every 1 to 2 weeks and recalibration every 1 to 7 days is more valuable than upgrading to a higher-priced analyzer while keeping poor maintenance habits unchanged.
Temperature is another major factor. Many electrochemical measurements assume compensation near 20°C to 25°C, but actual samples may arrive at 12°C, 35°C, or fluctuate during transfer from process line to bench. If temperature equilibration is skipped, measurement offset can become systematic rather than random, making internal trend data look consistent while still being wrong.
Four control points that determine repeatability
- Standard preparation: Use fresh standards matched to the expected range, ideally covering at least 2 to 3 calibration points instead of relying on a single check solution.
- Electrode care: Clean according to sample type, especially after oily, high-solid, or protein-rich matrices, and replace worn components before drift becomes visible in production results.
- Measurement timing: Keep immersion time, stirring rate, and stabilization criteria consistent, such as waiting until drift is below a predefined threshold for 10 to 30 seconds.
- Documentation: Record slope, offset, temperature, sample condition, and operator identity so abnormal variance can be traced rather than guessed.
Where technical evaluators often misjudge accuracy
A common mistake is to compare datasheet resolution with operational accuracy. Resolution may display 0.001 units, but real repeatability may be limited by electrode response, contamination, sample instability, or calibration quality. Another mistake is evaluating accuracy only during factory acceptance while ignoring performance after 60 or 180 days in field service.
Technical assessment should include at least 3 phases: initial installation qualification, routine verification under normal workload, and stress verification under difficult sample conditions. This approach reveals whether the Electrochemistry Analyzer remains dependable when exposed to changing operators, variable matrices, and maintenance gaps.
How to Compare Methods by Application, Not by Marketing Claims
The instrumentation industry serves very different environments, from laboratory R&D benches to industrial skids and environmental stations. Because of that, accuracy has to be judged in context. A method that performs well in a clean laboratory may lose reliability on a production floor with vibration, dust, chemical splash, and 24-hour duty cycles.
For example, an Electrochemistry Analyzer may be the most practical choice for boiler water conductivity, wastewater pH, plating bath control, or ion concentration checks where fast decisions are needed every 5 to 30 minutes. Spectroscopy may be better for trace contamination profiling, while titration may remain preferred for formal moisture or alkalinity testing tied to established internal procedures.
Evaluators should also separate absolute accuracy from decision usefulness. In many process applications, what matters most is whether the method can reliably detect a control limit, such as a conductivity threshold, pH window, or concentration shift. A slightly lower theoretical precision may still deliver better operational accuracy if the workflow is simpler and less error-prone.
Application-based evaluation matrix
The following table can help technical teams compare methods based on sample type, maintenance capacity, and result timing requirements.
This comparison shows why method choice should begin with use-case mapping. For industrial and QC decisions, the best method is often the one that balances acceptable uncertainty with stable operation, manageable maintenance, and clear traceability across shifts, batches, and sites.
Selection criteria technical evaluators should score
- Measurement range suitability for the expected concentration band and upset conditions.
- Calibration frequency and the labor needed per week or per month.
- Sensitivity to matrix interference, especially solids, oils, salts, organics, and temperature swings.
- Availability of verification records, audit trails, and integration with laboratory or plant data systems.
- Total operating burden over 12 months, not just purchase price at the quotation stage.
Implementation, Verification, and Maintenance Strategy
An Electrochemistry Analyzer can deliver strong accuracy only when implementation is structured. Technical teams should avoid treating commissioning as a one-day event. A more reliable model is a 5-step deployment cycle covering method fit review, installation, calibration qualification, operator training, and routine verification scheduling.
In integrated instrumentation environments, this matters even more. The analyzer may feed values into PLC logic, SCADA dashboards, batch records, or environmental logs. A small measurement bias can therefore affect alarms, dosing, release decisions, or trend reports. Verification routines should be built into the wider measurement and control architecture rather than treated as isolated lab tasks.
A practical maintenance strategy should define daily, weekly, and monthly actions. Daily checks may include visual inspection and standard verification. Weekly actions may cover cleaning and drift review. Monthly or quarterly actions often include slope checks, electrode replacement decisions, connector inspection, and cross-comparison against a reference method.
Typical implementation workflow
- Confirm application purpose: release testing, continuous monitoring, process control, or research evaluation.
- Define acceptance criteria such as repeatability target, allowable drift, stabilization time, and verification frequency.
- Run side-by-side testing for at least 10 to 20 representative samples across normal and edge conditions.
- Train operators using the same sample handling and calibration script for all shifts.
- Review data after 2 to 4 weeks and adjust cleaning interval, calibration plan, or sampling method if bias appears.
Maintenance checkpoints that protect accuracy
The most effective accuracy protection often comes from routine discipline rather than major hardware changes. If a site sees unexplained variance, the first review should include electrode response trend, standard freshness, sample transport time, and temperature compensation settings. In many facilities, these 4 checks resolve more issues than replacing the analyzer itself.
For multi-site organizations, standardizing maintenance intervals is also valuable. If one plant calibrates every day and another every 14 days, the difference in data quality may reflect local habits rather than actual process conditions. Consistent procedures improve comparability across regions, lines, and production campaigns.
Procurement Risks, FAQ, and Final Selection Advice
Procurement decisions for an Electrochemistry Analyzer should not focus only on upfront price or nominal specifications. Technical evaluators need to check whether the analyzer matches sample chemistry, maintenance resources, and integration requirements. A lower-cost unit may create higher 12-month ownership cost if electrode life is short, calibration is frequent, or documentation functions are limited.
It is also important to ask how the method will be validated after purchase. A strong supplier discussion should cover consumables, probe compatibility, lead time for replacement parts, routine support scope, and expected commissioning support. In instrumentation projects, a realistic delivery and setup cycle may range from 2 to 6 weeks depending on configuration, accessories, and site readiness.
Below are several practical questions that often arise during technical review and sourcing discussions.
How do I know whether an Electrochemistry Analyzer is better than titration for my process?
Choose based on decision speed, matrix stability, and maintenance discipline. If the process needs frequent readings, low reagent handling, or online integration, an Electrochemistry Analyzer is often the better operational choice. If the chemistry has a well-defined endpoint and the lab already maintains strong reagent control, titration may remain more suitable for reference testing or formal confirmation.
What indicators should be included in a supplier evaluation sheet?
At minimum, score 6 items: measurement range, repeatability under real samples, calibration frequency, electrode or sensor replacement cycle, data logging capability, and support response time. For regulated or audited operations, add method traceability, user management, and verification documentation features.
What are the most common mistakes after installation?
The most common issues are using old standards, ignoring electrode cleaning after dirty samples, applying one calibration routine to very different matrices, and assuming factory settings fit every site. Another frequent mistake is skipping cross-checks against a reference method during the first 30 days, which delays identification of systematic bias.
Which procurement risks should be reviewed before ordering?
The table below summarizes the main decision points that affect long-term accuracy and ownership value.
For most technical evaluators, the safest choice is not the method with the most impressive isolated specification. It is the method that maintains stable results under the actual sample load, staffing pattern, maintenance culture, and control system used on site. That is where an Electrochemistry Analyzer often proves its value, provided implementation and upkeep are treated as part of the measurement system.
If you are assessing options for laboratory analysis, industrial online monitoring, or quality-control workflows, a structured comparison can reduce risk before purchase. Contact us to discuss your application conditions, compare method suitability, and get a tailored solution that supports reliable accuracy in real operating environments.
Recommended for You
 How to reduce customer support response timesReduce Customer Support response times with actionable tips for reporting equipment faults, choosing the right channel, and getting expert help faster.
 How to choose a low range analyzer for trace-level measurementsChoose the right low range analyzer for trace-level measurements. Compare detection limits, sampling, calibration and support to make a confident decision.
 How to choose combustible gas detectors for a specific gasChoose combustible gas detectors with confidence. Compare sensor technologies, gas response, calibration, placement, and certification for your application.
 How to choose an air quality analyzer for the pollutants you need to measureChoose an air quality analyzer with confidence. Compare pollutant measurement methods, sampling, accuracy and calibration to find the right fit for your needs.
 How to choose industrial metrology tools for tight tolerancesChoose industrial metrology tools for tight tolerances with confidence. Compare uncertainty, calibration, tool types, and costs to reduce inspection risk.
 How moisture affects fixed analyzer accuracy in stack gas monitoringImprove fixed analyzer accuracy in stack gas monitoring. Discover how moisture causes dilution, interference, and sample loss—and learn practical ways to protect emissions data.
 How does production line speed affect in-line measurement accuracy?Discover how production line speed affects in-line measurement accuracy. Explore sensor response, sampling, and timing to boost throughput without compromising quality.
 How condensation affects HCl concentration analyzer accuracyHCl concentration analyzer accuracy can suffer when condensation traps HCl. Learn how to spot sampling losses, prevent low readings, and improve measurement reliability.
 How does cross-interference affect multi-component gas analyzers?How does cross-interference affect multi component gas analyzers? Explore measurement errors, compensation limits, and validation tips to choose the right system for your process.
 How does temperature affect high-accuracy sensor performance?Explore how temperature affects high accuracy sensor performance. Learn to reduce thermal drift, evaluate compensation, and select the right sensor for reliable measurements.
 Can a C4H8O concentration analyzer distinguish between isomers?Can a C4H8O concentration analyzer distinguish isomers? Compare GC, FTIR and MS methods, uncover selectivity limits, and learn what to validate before choosing your instrument.
 How to identify a reliable supplier using on-time delivery recordsIdentify a Reliable Supplier by verifying on-time delivery records, original commitments, and complete shipments. Learn practical checks to reduce purchasing risk and protect your project schedule.
 How sensitive should a portable hydrogen analyzer be for lab use?Choose a portable hydrogen analyzer for laboratory use with the right quantification limit, accuracy, and range. Learn how to verify performance and avoid costly buying mistakes.
 How to set industrial calibration intervals based on equipment riskSet industrial calibration intervals based on equipment risk, drift, and as-found data. Learn when to shorten or extend schedules to improve reliability and avoid unnecessary costs.
 How to choose electrochemical analyzers for low-current measurementsCompare electrochemical analyzers for precise low-current measurements. Learn how noise, leakage, bandwidth, and real-cell testing help you choose the right instrument.
 What tolerance does a custom gas mixture need for calibration?Choose the right custom gas tolerance for calibration. Learn how blending tolerance, certified uncertainty, and stability affect accuracy—and avoid paying for precision you don’t need.
 How condensation affects stack detector readings in wet flue gasStack detector readings can drift when wet flue gas condenses. Learn how to identify moisture interference, prevent sample losses, and improve emissions monitoring reliability.
 How to prevent condensation in a CO2 analyzer sampling systemPrevent condensation in your CO2 analyzer sampling system. Learn how to control dew point, eliminate cold spots, and manage moisture for reliable readings and fewer costly disruptions.
 How to verify accuracy claims for industrial quality analyzersVerify accuracy claims for industrial quality analyzers with calibration checks, independent testing, and clear acceptance criteria. Learn how to reduce risk and buy with confidence.
 How to calculate cooling loads for an industrial analyzer shelterSize industrial analyzer shelter cooling with confidence. Learn to calculate equipment heat, solar gains, and ventilation loads, then select HVAC capacity for reliable analyzer performance.
 Hydrogen Analyzers for Energy Storage: Purity Monitoring vs. Leak DetectionChoosing a hydrogen analyzer for energy storage systems? Compare purity monitoring and leak detection to select the right sensors, improve safety, and protect fuel cell performance.
 NH3 Monitoring in Fertilizer Plants: Where Should Leak Analyzers Be Installed?NH3 analyzer for fertilizer production: discover where to place leak detectors around storage, compressors, and loading areas to reduce blind spots and improve early warning.
 Diesel Engine NOx Analyzers: Response Time and NO2 Conversion ExplainedChoosing a NOX analyzer for diesel engines? Learn how response time, NO2 conversion, and sampling design affect accuracy—and make a smarter, evidence-based purchase.
 SO2 Analyzers for Smelter Emissions: Sampling Hot, Dust-Laden Flue GasSelect an SO2 analyzer for smelting industry applications. Discover how to handle hot, dust-laden flue gas, prevent sample losses, and achieve reliable emissions monitoring.
 Unstable CH4 Readings in Biogas Monitoring? Check Moisture and Sample FlowCH4 analyzer for biogas monitoring giving unstable readings? Discover how moisture, sample flow, and pressure checks help pinpoint faults and restore reliable methane measurements.
 Buying a CO2 Analyzer for Brewery Gas Recovery: Costs Beyond the Purchase PriceBuying a CO2 analyzer for brewery applications? Compare sampling, installation, calibration, and downtime costs to uncover hidden expenses and make a smarter gas recovery investment.
 Where to Place CO Analyzers for Effective Parking Garage VentilationOptimize your CO analyzer for parking garage ventilation with practical placement tips. Learn how sensor height, airflow, and zone coverage support timely detection and effective fan control.
 NDIR vs. FTIR Gas Analyzers: Which Fits Your Environmental Research?Find the right infrared gas analyzer for environmental research. Compare NDIR vs. FTIR on sensitivity, gas coverage, sampling needs, and cost to choose confidently for your study.
 Oxygen Analyzers for Diving: Calibration Checks Before Nitrox BlendingUsing an oxygen analyzer for diving applications? Discover essential calibration, sensor, and sampling checks before nitrox blending to support reliable readings.
 How Paramagnetic Oxygen Analyzers Work and Why Sample Pressure MattersLearn how a paramagnetic oxygen analyzer works, why sample pressure affects accuracy, and what to check in compensation and calibration before choosing your system.
 How Much Does a Complete CEMS Integration Project Typically Cost?How much does a complete CEMS integration project typically cost? Explore budget ranges, hidden installation costs, and compliance needs to compare quotes and plan confidently.
 What Is the Typical Response Time for Industrial Air Monitors?What is the typical response time for industrial air monitors? Explore T90, sampling delays, and alarm settings to compare performance and choose the right monitor with confidence.


Search Categories
Search Categories
- Smart Meters & Power Quality
- Transformer Gas Analyzers
- BESS Thermal Runaway Detectors
- Energy, Power & Smart Grid Monitoring
- Optical Profilers & CMM
- Ultrasonic & X-Ray NDT
- Calibration Standards
- Precision Metrology & NDT
- Water Quality Analyzers
- CEMS & VOCs Monitors
- Price Trends
- Import & Export Updates
- Market Trends
- Industry News
- Industry Insights
Latest Article
- How to reduce customer support response timesReduce Customer Support response times with actionable tips for reporting equipment faults, choosing the right channel, and getting expert help faster.Posted by:
- How to choose a low range analyzer for trace-level measurementsChoose the right low range analyzer for trace-level measurements. Compare detection limits, sampling, calibration and support to make a confident decision.Posted by:
- How to choose combustible gas detectors for a specific gasChoose combustible gas detectors with confidence. Compare sensor technologies, gas response, calibration, placement, and certification for your application.Posted by:
Please give us a message